Core Math Worksheets
Fraction Worksheets
Word Problems
Algebra
Other Worksheets
Place Value
Percentages
Rounding Numbers
Ordering Numbers
Standard, Expanded, Word Form
Mean Median Mode Range
Ratio Worksheets
Probability Worksheets
Roman Numerals
Factorization, GCD, LCM
Prime and Composite Numbers
Pre-Algebra
Geometry Worksheets
Blank Clocks
Telling Analog Time
Analog Elapsed Time
Greater Than and Less Than
Money
Arithmetic Sequences
Geometric Sequences
Venn Diagram
Graph Worksheets
Measurement & Conversions
Patterns and Puzzles
Color by Number
Holiday & Seasonal
Early Learning
Printables
Calculators
Math Worksheets by Grade
Worksheet News
Quadratic Equations Worksheets
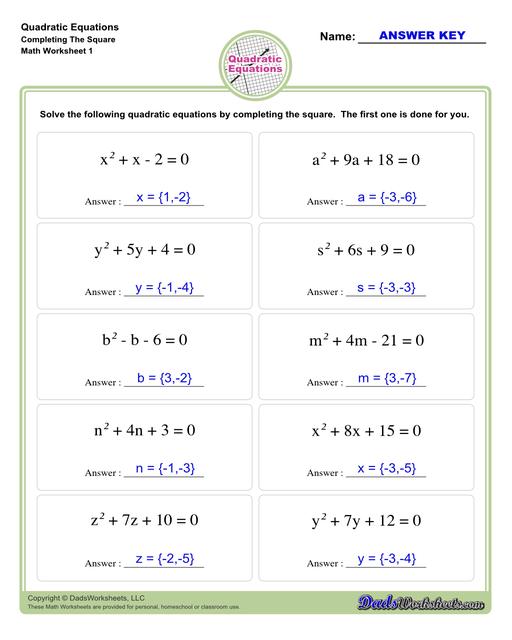
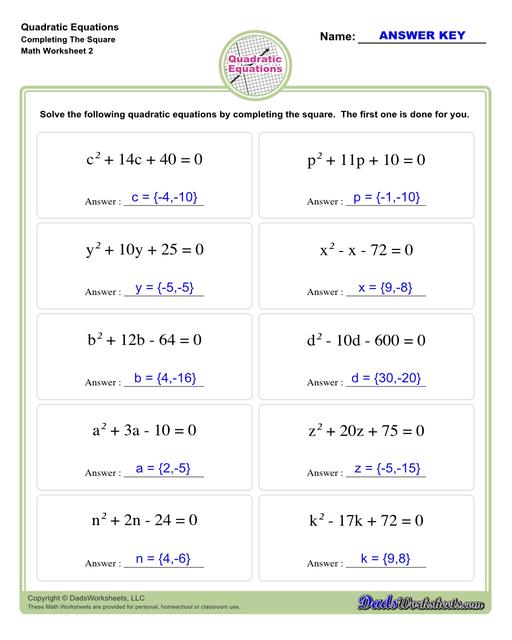
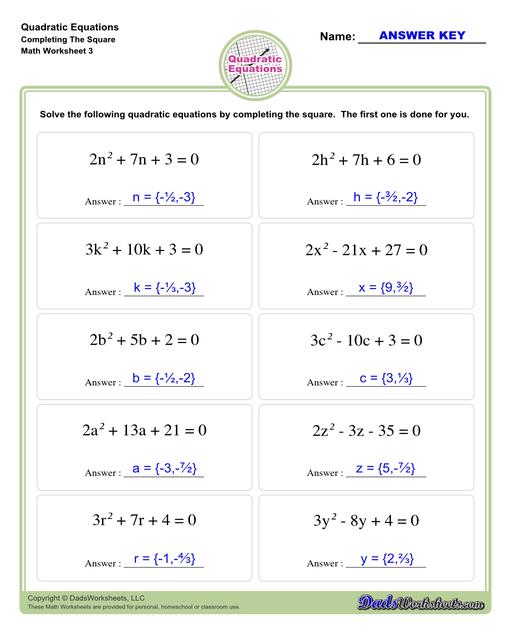
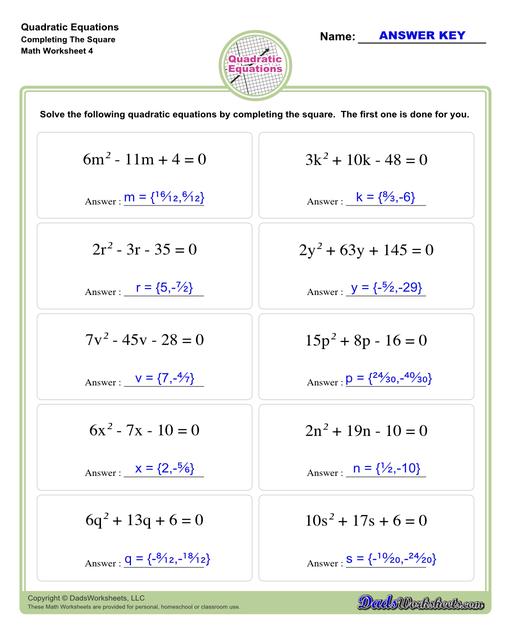
These quadratic equations worksheets cover techniques for finding solutions including completing the square, finding roots and solving by graphing.
Completing the Square Worksheets
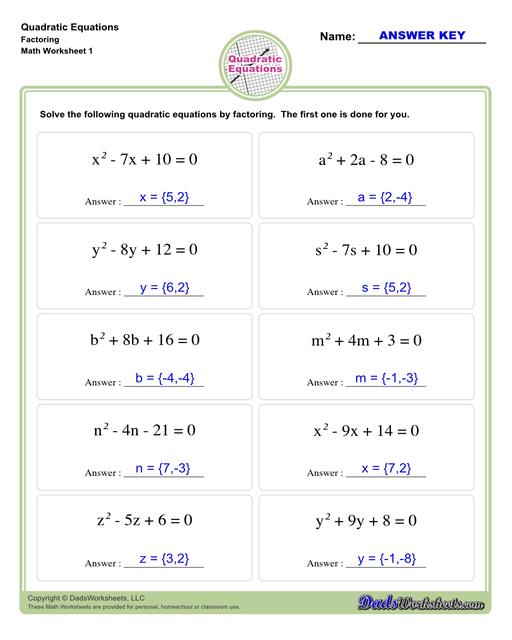
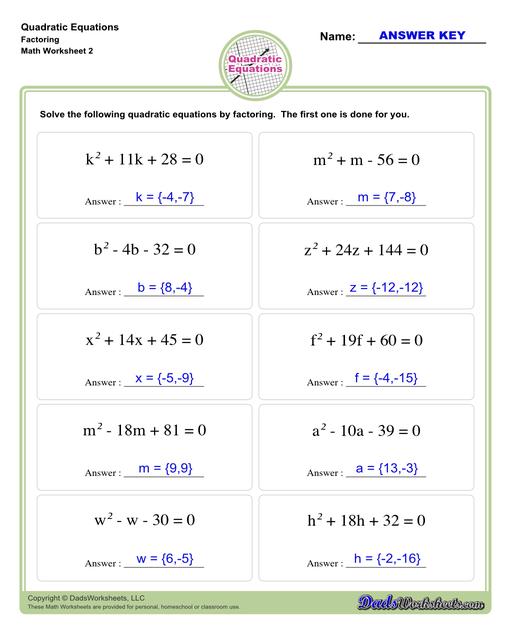
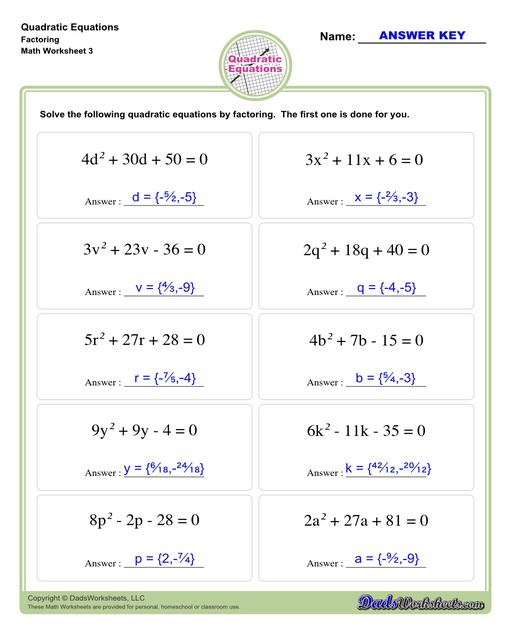
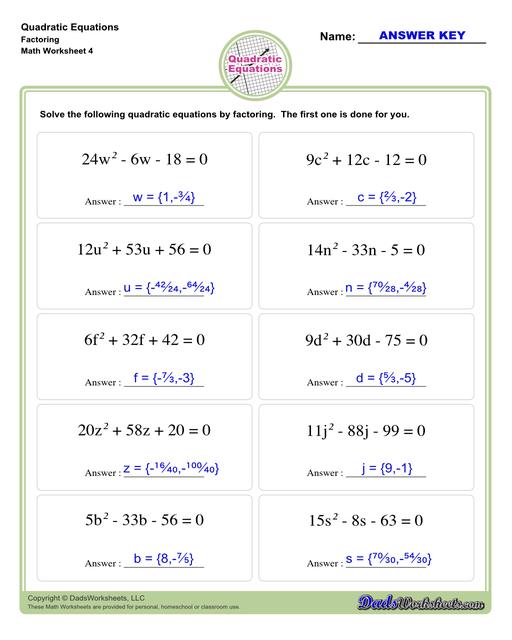
Solve by Factoring Worksheets
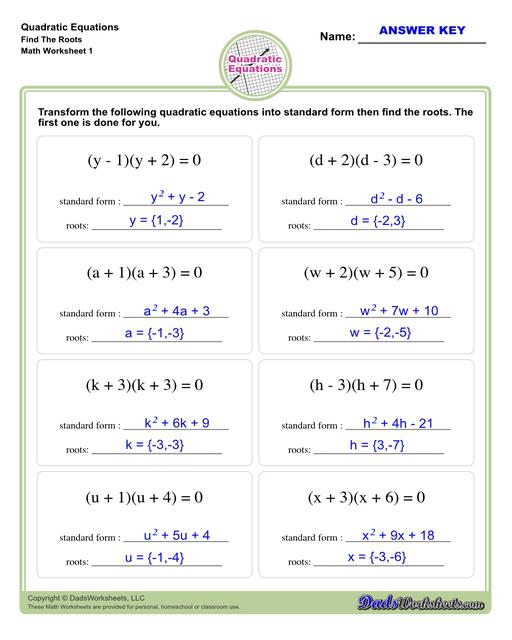
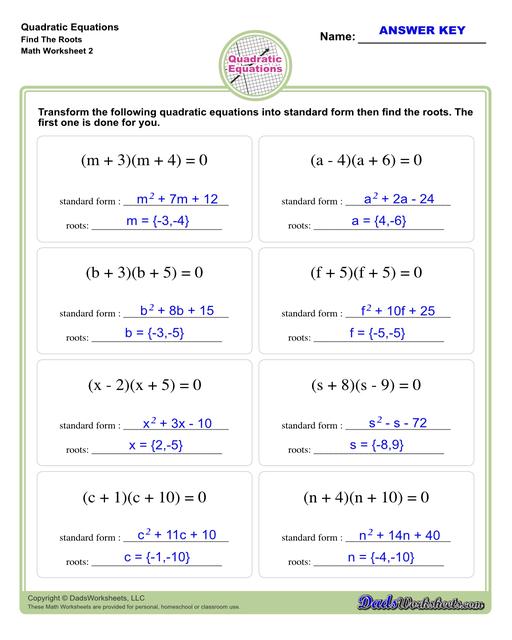
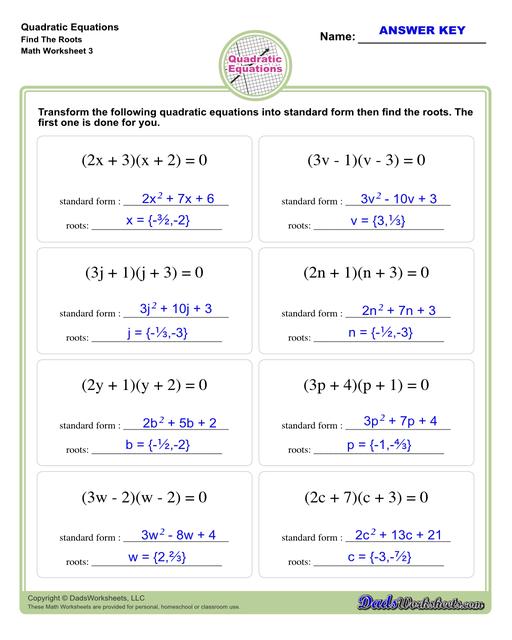
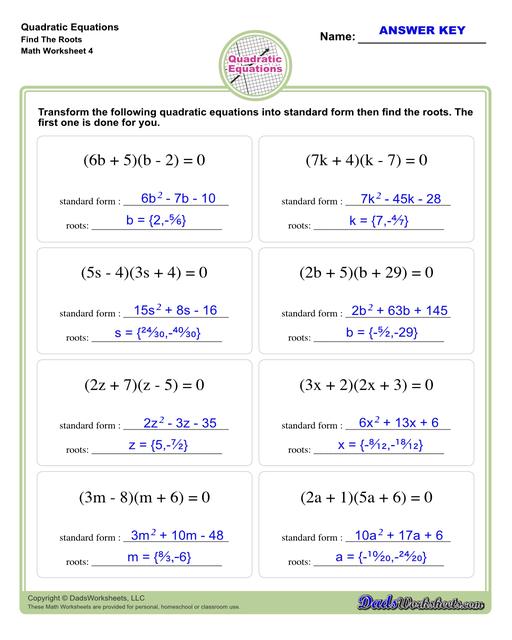
Solve by Finding Roots Worksheets
Solve by Graphing Quadratic Worksheets
Quadratic Formula Worksheets
Methods for Solving Quadratic Equations
The quadratic equations worksheets on this page will require students to solve quadratic equation problems using five different methods including completing the square, factoring, finding the roots, using the quadratic formula, and lastly by graphing. All of these worksheets include answer keys. If you’re ready, just click and print any of the worksheets below.
Parts of a Quadratic Equation
Quadratic equations are second-degree polynomial equations of the form:

In this equation:
- x represents the variables.
- a, b, and c are constants, where a cannot be zero. These constants determine the shape, position, and behavior of the quadratic equation's graph.
- The term ax^2 is called the quadratic term.
- The term bx is the linear term.
- The constant c is the constant term.
The highest power of the variable x in a quadratic equation is x^2, making it a second-degree equation. Quadratic equations are named as such because the highest power of the variable x^2 is "quad" or “squared."
Graphical Representation
Graphically, quadratic equations represent parabolas, which are U-shaped curves. The shape and position of the parabola depend on the coefficients a, b, and c in the quadratic equation. The shape of the parabola can also be easily detemined on the sign of the coefficient a:
- If a > 0, the parabola opens upwards.
- If a < 0, the parabola opens downwards.

Vertex of a Parabola
The vertex, or the point at which the parabola makes its sharpest turn, represents the minimum or maximum point, depending on whether the parabola opens upwards or downwards.
The vertex of a quadratic function is the absolute minimum (in the case of an upward-opening parabola) or maximum (in the case of a downward-opening parabola) of that function.
In other words, this is the point where the parabola intersects its axis of symmetry and is the point where the parabola is most sharply curved. Knowing how to find the vertex of a parabola enables us to write the equation of a parabola given only limited information about it.
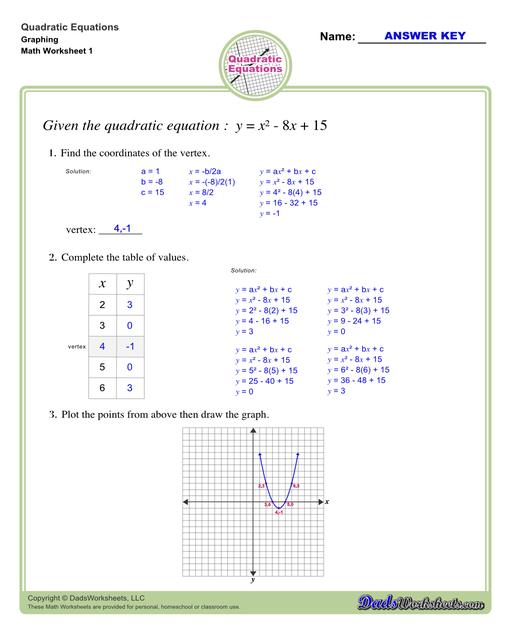
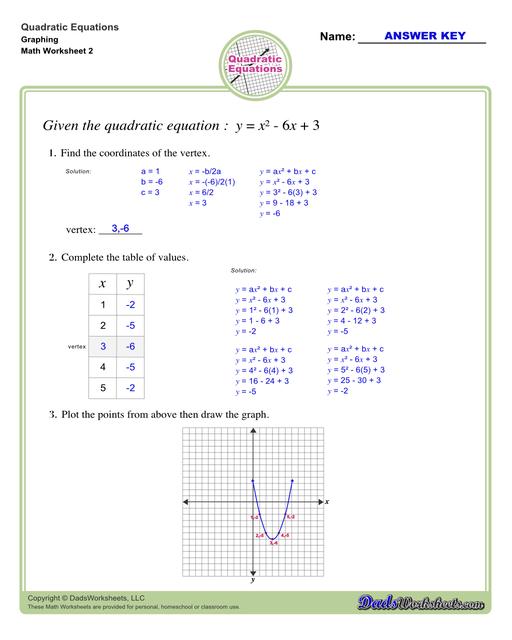
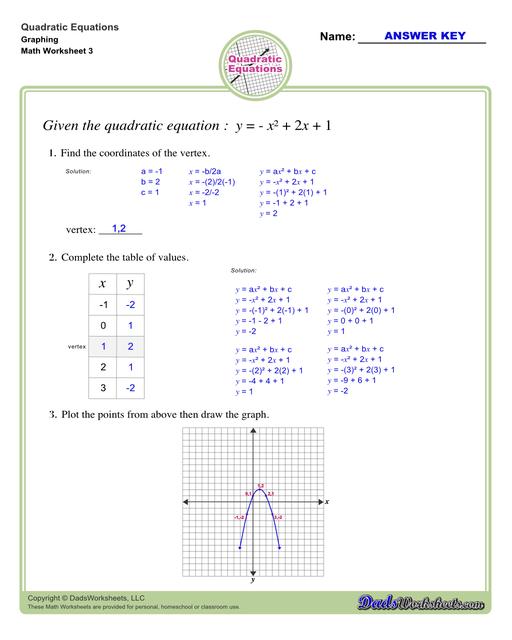
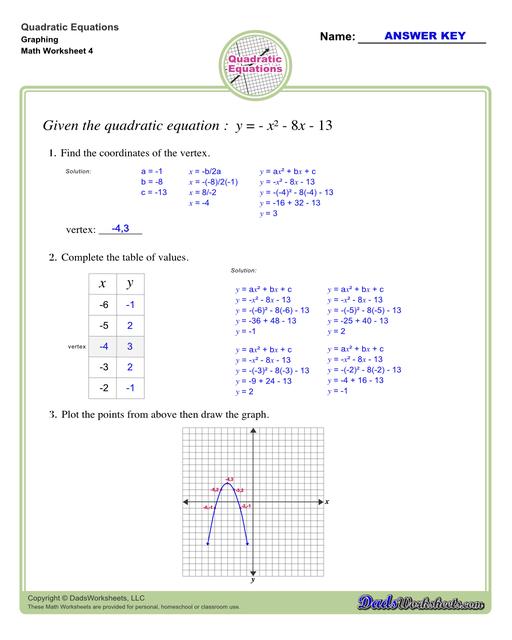
To find the vertex of a parabola that is in standard form y = ax^2 + bx + c:
- Use h = -b/2a for finding h.
- Substitute x = h in the given equation to find k.
- Then (h, k) is the vertex
Let’s use the example below and find its vertex…

- First, write down the value of the constants a, b, and c.
- Use the formula h = -b/2a to find the x-coordinate of the vertex.
- To find the y-coordinate of the vertex, substitute x in the given quadratic equation.
- Take note that x = h, and k = y.

Therefore (h,k) or the vertex is at point (-1,2).
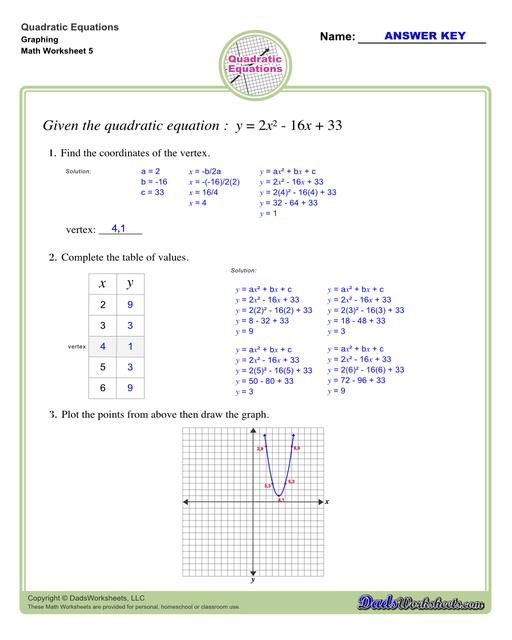
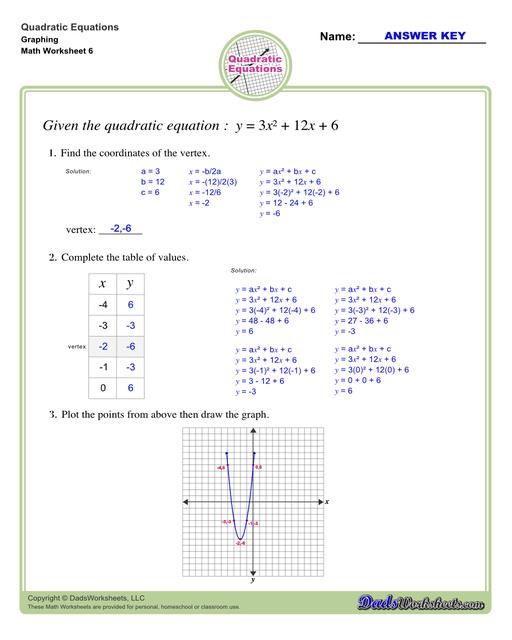
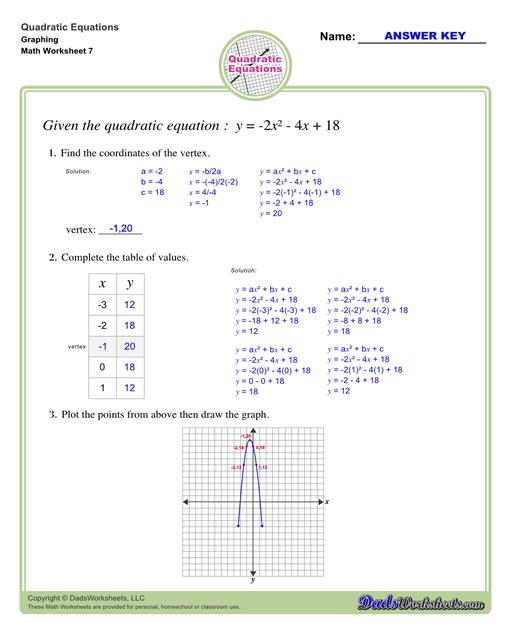
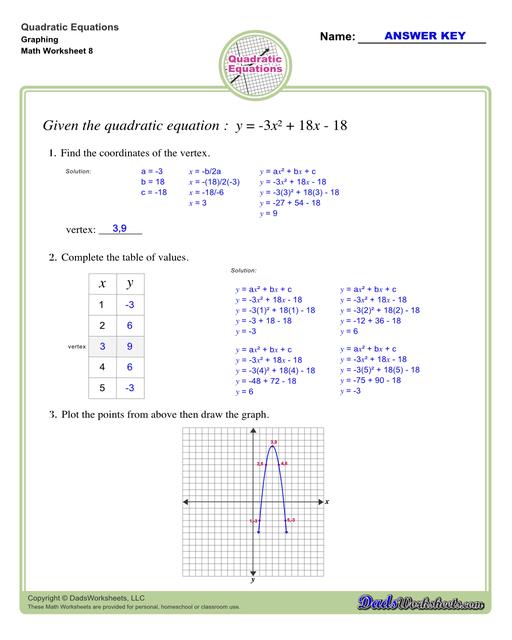
We can use the vertex of a parabola to graph the quadratic equation. For this, form a table of two columns labelled x and y with at least 5 rows. In the x-column, one of the numbers should be the x-coordinate of the vertex and two random numbers on each side (left and right) of it. Find the y-coordinate of each of the x-values by substituting each of them into the equation. Here’s how…

Now, you can plot the points from the table and graph. Refer to the image below…

Solving Quadratic Equations
There are several methods for solving quadratic equations. Let’s discuss the methods one by one along with examples for each.
Completing the Square: This method involves transforming the quadratic equation into a perfect square trinomial, which can then be easily solved by taking the square root.
To solve a quadratic equation by completing the square, follow these steps:
- Move the Constant Term to the Other Side. Rewrite the equation so that the constant term c is on the opposite side of the equation, isolating the x^2 and x terms on one side.
- Use the formula (b/2)^2 then add the result to both sides. This step creates a perfect square trinomial on the left side of the equation.
- Factor the Perfect Square Trinomial. Rewrite the perfect square trinomial as the square of a binomial.
- Take the square root of both sides of the equation and solve for x. Be sure to include both the positive and negative square root.
Take a look at this example:

- Simplify the solution, if needed.
- For checking purposes, substitute the solutions back into the original quadratic equation to ensure they satisfy the equation.
Factoring: If the quadratic expression can be factored into two linear expressions, then we can set each factor equal to zero and solve for x. This method of solving a quadratic equation involves expressing it as the product of two binomial factors. Here are the steps to factor a quadratic equation:
- Start with a quadratic equation in the form ax^2 + bx + c = 0. Put all terms on one side of the equal sign, leaving zero on the other side.
- Look for any common factors among the coefficients a, b, and c. If there are common factors, factor them out.
- Find two numbers that multiply to give the product of a*c and add up to b. These two numbers will be the coefficients of the binomial factors. If coefficient a is 1, simply find two factors of c that add up to b.
- Express the quadratic equation as the product of two binomial factors.
- Multiply the binomial factors to ensure that they expand back to the original quadratic equation.
- Set each binomial factor equal to zero and solve for x. These solutions will give you the roots or zeros of the quadratic equation.
Here’s an example:

- Substitute the solutions back into the original quadratic equation to ensure they satisfy the equation.
- If possible, simplify the factored form of the quadratic equation.
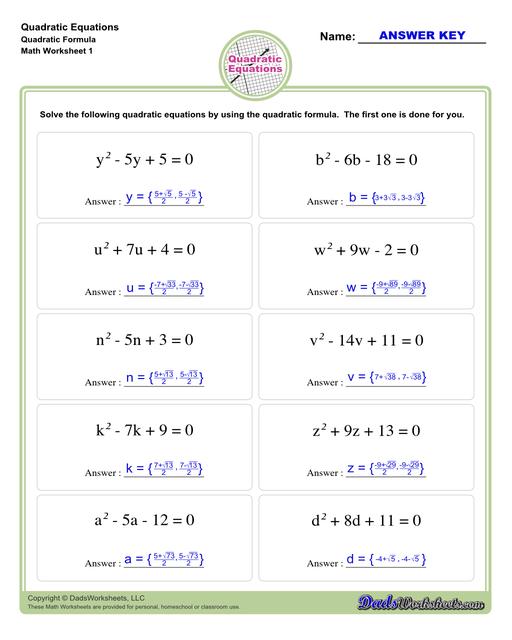
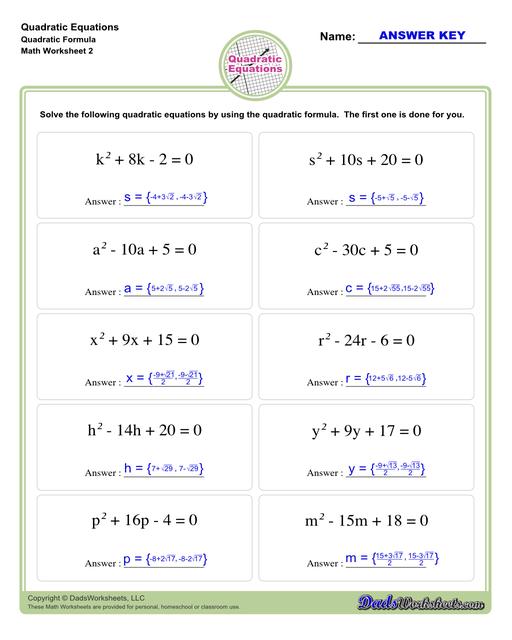
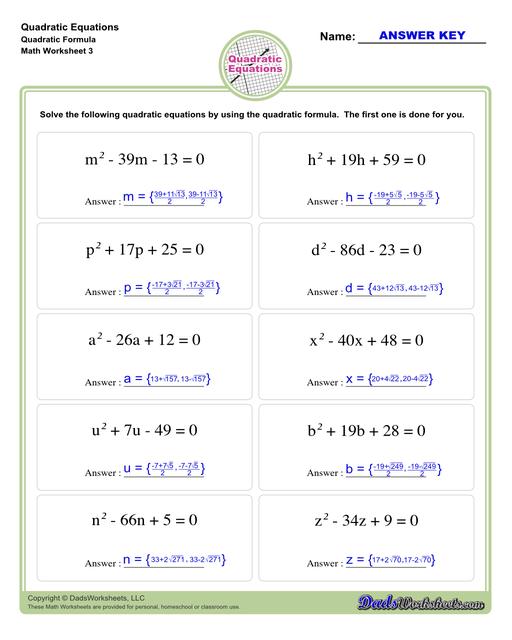
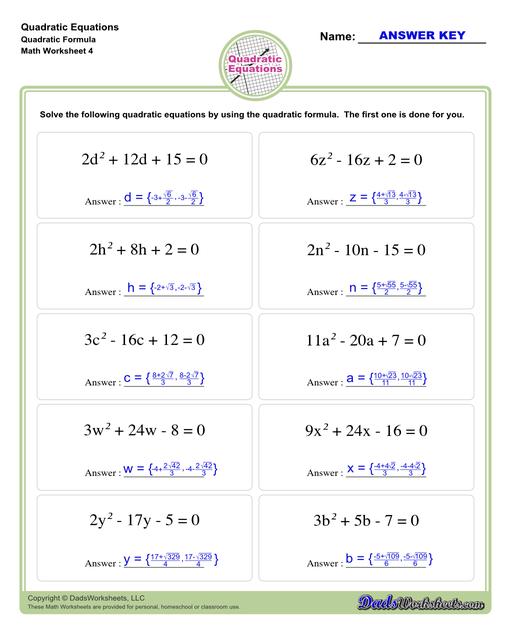
Quadratic Formula: The quadratic formula is a universal method for solving quadratic equations. It provides a direct method for finding the roots of a quadratic equation. This is specially true if the quadratic equations cannot be solved by factoring when the roots, or answers, are not rational numbers. This method of solving quadratic equations involves the use of the following formula:

where a, b, and c are the coefficients of the quadratic equation. a is the numeral that goes in front of x^2, b is the numeral that goes in front of x, and c is the numeral with no variable next to it.
Refer to the example below…

Graphical Method: The graphical method of solving a quadratic equation involves plotting the equation on a graph and finding the points where the graph intersects the x-axis, which represent the solutions to the equation. Here are the steps to solve a quadratic equation graphically:
- First, plot the quadratic equation y = ax^2 + bx + c on a graph, where a, b, and c are the coefficients of the quadratic equation.
- Identify the vertex of the parabola. The vertex is the highest or lowest point on the graph depending on whether the coefficient “a” is positive or negative. This will give you the axis of symmetry of the parabola.
- Identify the x-Intercepts. The x-intercepts are the points where the graph crosses the x-axis. These points represent the solutions to the quadratic equation. If the graph doesn't intersect the x-axis, it means the quadratic equation has no real solutions.
- Once you've identified the x-intercepts, read their corresponding x-values. These x-values are the solutions to the quadratic equation.
- If needed, verify the solutions by substituting them back into the original quadratic equation to ensure they satisfy the equation.
Remember, if the quadratic equation doesn't intersect the x-axis (i.e., it has no real solutions), it means the solutions are complex. In this case, the graphical method won't directly provide the solutions, but it can still help in understanding the behavior of the equation.

