Core Math Worksheets
Fraction Worksheets
Algebra
Other Worksheets
Place Value
Percentages
Rounding Numbers
Ordering Numbers
Standard, Expanded, Word Form
Mean Median Mode Range
Ratio Worksheets
Probability Worksheets
Roman Numerals
Factorization, GCD, LCM
Prime and Composite Numbers
Pre-Algebra
Geometry Worksheets
Blank Clocks
Telling Analog Time
Analog Elapsed Time
Greater Than and Less Than
Money
Arithmetic Sequences
Geometric Sequences
Venn Diagram
Graph Worksheets
Measurement & Conversions
Patterns and Puzzles
Color by Number
Holiday & Seasonal
Early Learning
Printables
Calculators
Math Worksheets by Grade
Worksheet News
Mean, Median, Mode and Range Worksheets
These worksheets introduce the concepts of mean, median, mode and range. These values are calculated on sequences of numbers and can be used to provide general statistics or summaries about groups of measurements or other groups of data. The worksheets on this page start with simple list of integers, but there are worksheets appropriate for using a calculator to calculate means and medians for larger values.
Mean, Median, Mode, Range Worksheets
24 Mean, Median, Mode and Range Worksheets
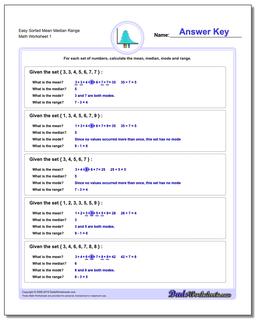
Problem worksheets for finding the mean, median, mode and range given a set of numbers. These are basic problems suitable for 'by-hand' calculations. The data in earlier problems are pre-sorted.
Mean, Median, RangeCalculator Mean, Median, Range
16 Mean, Median, Mode and Range Worksheets
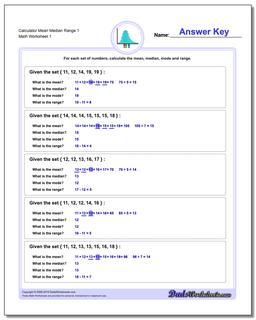
Harder problems for determining the mean, median, mode and range from a larger set of numbers. You will probably want a calculator to solve these problems.
Calculator Mean, Median, RangeNegative Mean, Median, Range
28 Mean, Median, Mode and Range Worksheets
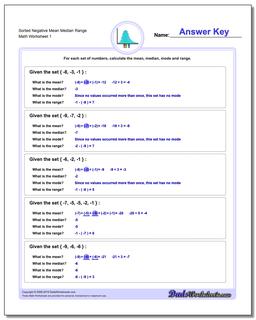
Problem worksheets for finding the mean, median, mode and range for sets of negative numbers.
Negative Mean, Median, RangeMixed Sign Mean, Median, Range
24 Mean, Median, Mode and Range Worksheets
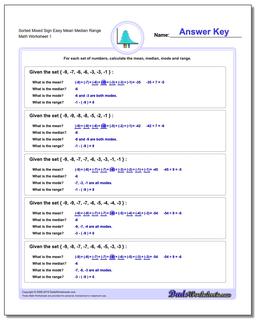
Problem worksheets for finding the mean, median, mode and range for sets of mixed sign numbers. These problems can be solved by hand, and earlier worksheets have the numbers sorted to make finding the median and mode easier.
Mixed Sign Mean, Median, RangeCalculator Mixed Sign Mean, Median, Mode, Range
12 Mean, Median, Mode and Range Worksheets
Harder Mixed Sign problems suitable for calculator practice.
Calculator Mixed Sign Mean, Median, Mode, RangeMean, Median Mode and Range Explained!
We deal with lists of numbers frequently, and we often need to summarize those lists in a way that makes comparisons easy. If you're just entering 6th grade, you'll need to be ready for these statistical comparisons! The mean, median, mode and range are all statistical values that make talking about a whole list of numbers easier.
So what do the terms mean, median, mode and range actually mean? And how do we calculate them? Let's find out!
What is the Mean?
The value you often call the 'average' is more correctly called the arithmetic mean. We calculate the mean by adding up all the values in the set, then dividing by the count of numbers in the set.
A good example of this is figuring out what the average score for all the students who took a test in a class. If you're a student in this class, you could sum everyone's score and then divide it by the number of students who took the test. That number would be the mean test score for that class, and you could compare your score to see whether you were above or below it to tell if you did (generally speaking) better or worse than your classmates.
You'll often find, especially when the number of samples being compared is small, that there are one or two values that can be extremes and that can have a larger effect on the mean, shifting it up or down more than you might expect. Often a strategy to avoid this shifting is to throw away outliers (for example, to not include the top or bottom scores in earned by our classmates) when calculating the mean, so that the average is more closely associated with a larger number of students.
Another way to help understand the effect of these outliers on the mean value is to consider other measurements. So let's talk about the median, mode and range!
What is the Median?
The median value is the value in the middle of all of our samples. Do you know what the median is on a road or highway? It's the thing in the middle. The same concept applies to the median of a set of numbers... If you put all of the values in order, the median would be one in the very middle of the set.
If we are back to our test taking example, if we knew the median score we would know exactly half of the students did better than that score on the exam, and exactly half of the students did worse.
If the scores are evenly distributed on both sides of the median, then the average and the median should be the same value. However if the median and the mmean are far apart, it's probably worth looking for outliers... Like that quiet kid in the back row who always seems to get 100% on the tests.
What do you do if you don't have an exact middle value in a set? For example, if our set of scores has an even number of values in it, then there isn't an single specific value in the exact middle. In that situation, average the two middle scores to calculate the median value.
What is the Mode?
So what about the mode? The mode is simply the specific value that occurs most frequently. Consider a test that had ten questions on it, each worth 10 points. If out of the class there were several students who scored 70 points on that test, an only one or two or none students got other scores such 80 points, 60 points or 100 points, the fact that 70 points occurred more frequently than any other result would make it the mode.
Again, in a perfect world with perfect distribution, there would be fewer results greater than the mode, also fewer results less than the mode, and the greater the discrepeancy between the mode and the median and the mean, the more the distribution of values is uneven.
A particularly strong mode in a set of numbers may make you question the way the data was collected, or even the measurement itself. For example, you might argue that a mode in the test scores at 70% suggests that three of those questions on the test were simply too difficult for the class, and that maybe one or two of those should be thrown out!
What is the Range?
The final piece of statistics that we'll look at here is the range. The range measures the distance between the greatest and the least value in the set. So again for our test-taking analogy, consider the high score and the low score and how large the span is between them.
If the highest score on our test was 90 points and the lowest score was 40 points, the range would be 50 points (90-40). If everybody got the same score no matter what it was, then the range would be zero.
Why do we care about the range? It tells us if the samples in our set are widely distributed, of if they're clustered more together. Saying the range is relatively small is another way of saying the samples are all near each other.
I hope this clears up a little bit of how the mean, median, mode and range all relate to the values in a collection of numbers, and I hope they help you talk your teachers into adjusting scores on an exam or two in your near future!

