
Core Math Worksheets
Fraction Worksheets
Algebra
Other Worksheets
Place Value
Percentages
Rounding Numbers
Ordering Numbers
Standard, Expanded, Word Form
Mean Median Mode Range
Ratio Worksheets
Probability Worksheets
Roman Numerals
Factorization, GCD, LCM
Prime and Composite Numbers
Pre-Algebra
Geometry Worksheets
Blank Clocks
Telling Analog Time
Analog Elapsed Time
Greater Than and Less Than
Money
Arithmetic Sequences
Geometric Sequences
Venn Diagram
Graph Worksheets
Measurement & Conversions
Patterns and Puzzles
Color by Number
Holiday & Seasonal
Early Learning
Printables
Calculators
Math Worksheets by Grade
Worksheet News
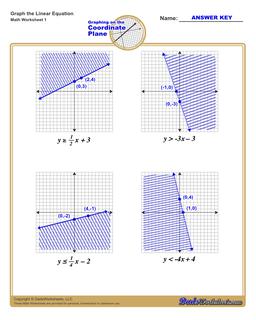
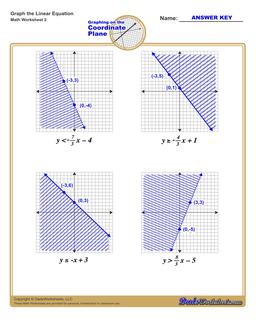
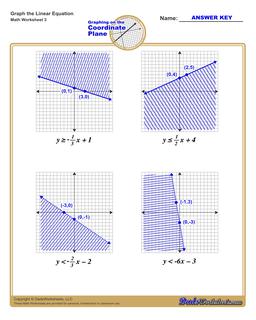
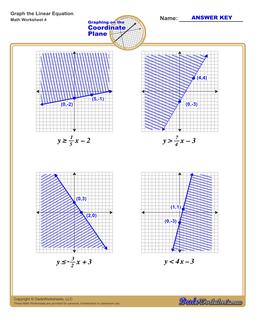
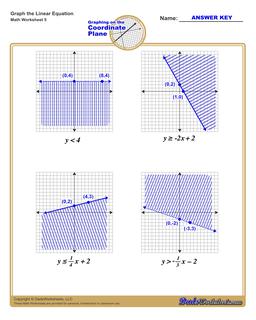
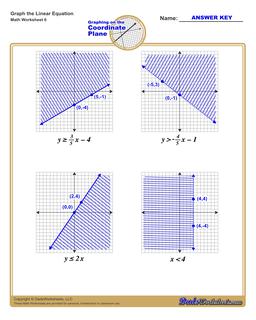
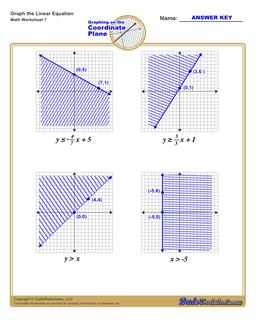
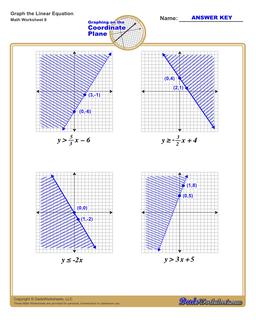
Graphing Linear Inequalities Worksheet
Each graphing linear inequalities worksheet on this page has four coordinate planes and linear inequalities in slope-intercept form, and includes an answer key showing the correct graph.
Graphing Linear Inequalities
What are Linear Inequalities?
Linear inequalities look very similar to slope intercept form equations, but use inequality operators instead of an equal sign.
An Example Linear Inequality
There are two additional steps you need to take into account when graphing linear inequalities. The linear equality describes not just a line, but also whether values above or below the line are included in a set of possible solutions. This is typically shown by shading the area above or below the line to indicate that the shaded values are included.
But beyond shading, the line itself may or may not be included as part of the solution set. You can make this determination by looking at the inequality operator in the linear inequality. If the inequality is "less than" or "greater than" in comparison, that means the points that would fall on the line are not included in the solution itself. By convention, this shown in the graph of the linear equality by drawing a dashed line instead of a solid line.
When a linear inequality uses the "greater than or equal to" or "less than or equal to" inequality operators, it means the points falling on the line ARE included in the solution set, and in those situations a solid line is drawn on the coordinate plane to reflect this.
With those two extra peices of information, along with some previous skill graphing linear equations, the steps to graph linear inequalities are fairly straightforward...
How to Graph Linear Inequalities
If you have a linear inequality in slope intercept form, you can use these steps to graph that inequality on the coordinate plane:
- Identify the y-intercept constant in the inequality (the 'b' term in the equation)
- Plot the y-intercept point on the coordinate plane at the (0,b) point.
- Identify the slope constant in the inequality (the 'm' value). Convert it to a fraction over 1 or an improper fraction if it is not already in fraction form.
- Treating the slope as a rise-over-run value, start at the y-intercept move along the y-axis a distance equal to the value from the slope's numerator, and move along the x-axis a distance equal to the slope's denominator. Plot that point.
- You will draw a line extending through the two plotted points, but the type of line depends on the inequality operator...
- If the inequality is a simple 'less than' or 'greater than', draw a dashed line to indicate the values actually on the line are NOT included in the result.
- If the inequality inequality is of the 'or equal' variety, draw a solid line to indicate values on the line ARE included in the result.
- Shade the area of the graph above or below the line based on inequality operator...
- For "greater than", or "greater than or equal to" inequalities, shade y values that are above the line.
- For "less than", or "less than or equal to" inequalities, shade y values that are below the line.
If you are graphing linear inequalities, the worksheets on this page provide great practice resources for middle school algebra students. You can also print a blank coordinate plane to graph other equations, or try working with the slope calculator to see how different points are used to calculate slope and make an equation in point slope form.
Copyright 2008-2024 DadsWorksheets, LLC