
Core Math Worksheets
Fraction Worksheets
Algebra
Other Worksheets
Place Value
Percentages
Rounding Numbers
Ordering Numbers
Standard, Expanded, Word Form
Mean Median Mode Range
Ratio Worksheets
Probability Worksheets
Roman Numerals
Factorization, GCD, LCM
Prime and Composite Numbers
Pre-Algebra
Geometry Worksheets
Blank Clocks
Telling Analog Time
Analog Elapsed Time
Greater Than and Less Than
Money
Arithmetic Sequences
Geometric Sequences
Venn Diagram
Graph Worksheets
Measurement & Conversions
Patterns and Puzzles
Color by Number
Holiday & Seasonal
Early Learning
Printables
Calculators
Math Worksheets by Grade
Worksheet News
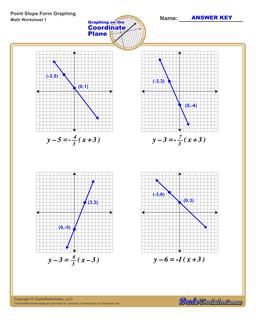
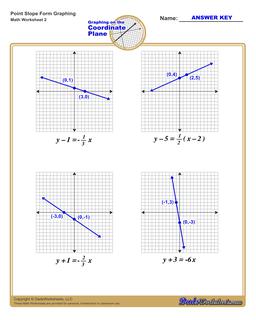
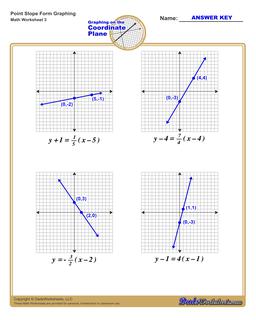
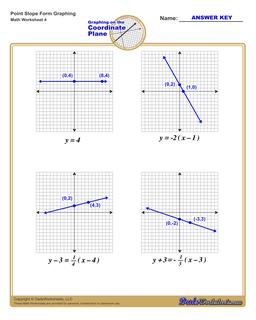
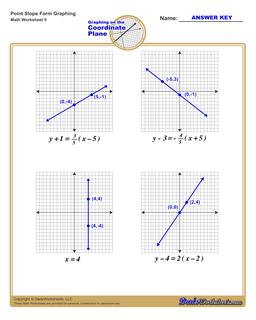
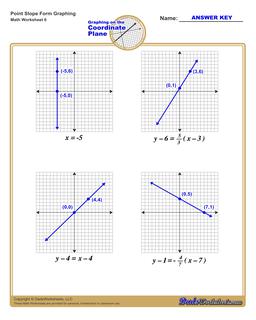
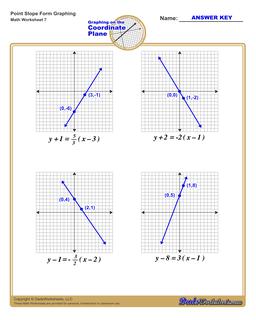
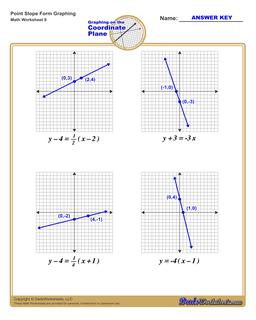
Graphing Equations in Point Slope Form
Each graphing linear equations worksheet on this page has four coordinate planes and equations in point-slope form, and includes an answer key showing the correct graph.
Graph Point Slope Form
What is Point Slope Form?
Equations that describe a line (i.e., a linear equations) are commonly shown in slope intercept form expressed in a form called point slope form that looks like this...
Point Slope Form
Equations in point slope are a great way to describe a line if you know the slope and at least one point on the line. You start with the point slope equation and substitute the slope constant for m, and then the x and y coordinates for the point for x1 and y1.
If you are graphing linear equations, the worksheets on this page provide great practice resources for middle school students. You can also use a blank coordinate plane to graph your own equations, or try working with the slope calculator to see how to find the slope from two points.
How to Find Linear Equations in Point Slope Form From Two Points
If you have two points that define a line, you can figure the find an equation in point slope form by following these steps :
- Find the slope of the line using the rise-over-run slope equation (See below).
- Substitute the m value in the y - y1 = m(x - x1) slope intercept equation with the calculated slope.
- Using either of the two points, substitute the x and y coordinates from the chosen point for x1 and y1
These steps are someone less complex compared to finding an equation in slope intercept form, which is part of why you sometimes see linear equation problems using this form instead. However, the two forms are equivalent and you can easily convert an point slope equation into a slope intercept equation by solving for y with another point on the line.
How to Graph Linear Equations in Point Slope Form
If you have an equation in point slope form, you can graph the equation by following these steps :
- Find the point from the x1 and y1 values in the equation on the coordinate plane.
- Using the rise and run from slope fraction in the equation, move from the x1, y1 point to a new point on the coordinate plane
- Draw a line extending through both points.
Some point slope equations may be missing the x1 or y1 coordinate values in the equation, and in those situations the implied value for the coordinate is zero. Such points will show where the line crosses the x axis or y axis, depending on which coordinate is zero.
If you are graphing linear equations, the worksheets on this page provide great practice resources for middle school algebra students. You can also print a blank coordinate plane to graph other equations, or try working with the slope calculator to see how different points are used to calculate slope and make an equation in point slope form.
Copyright 2008-2024 DadsWorksheets, LLC